Nebulabrot
Accumulative Visualization of Mandelbrot Orbital Paths
Launch Nebulabrot VisualizerWhat is the Nebulabrot?
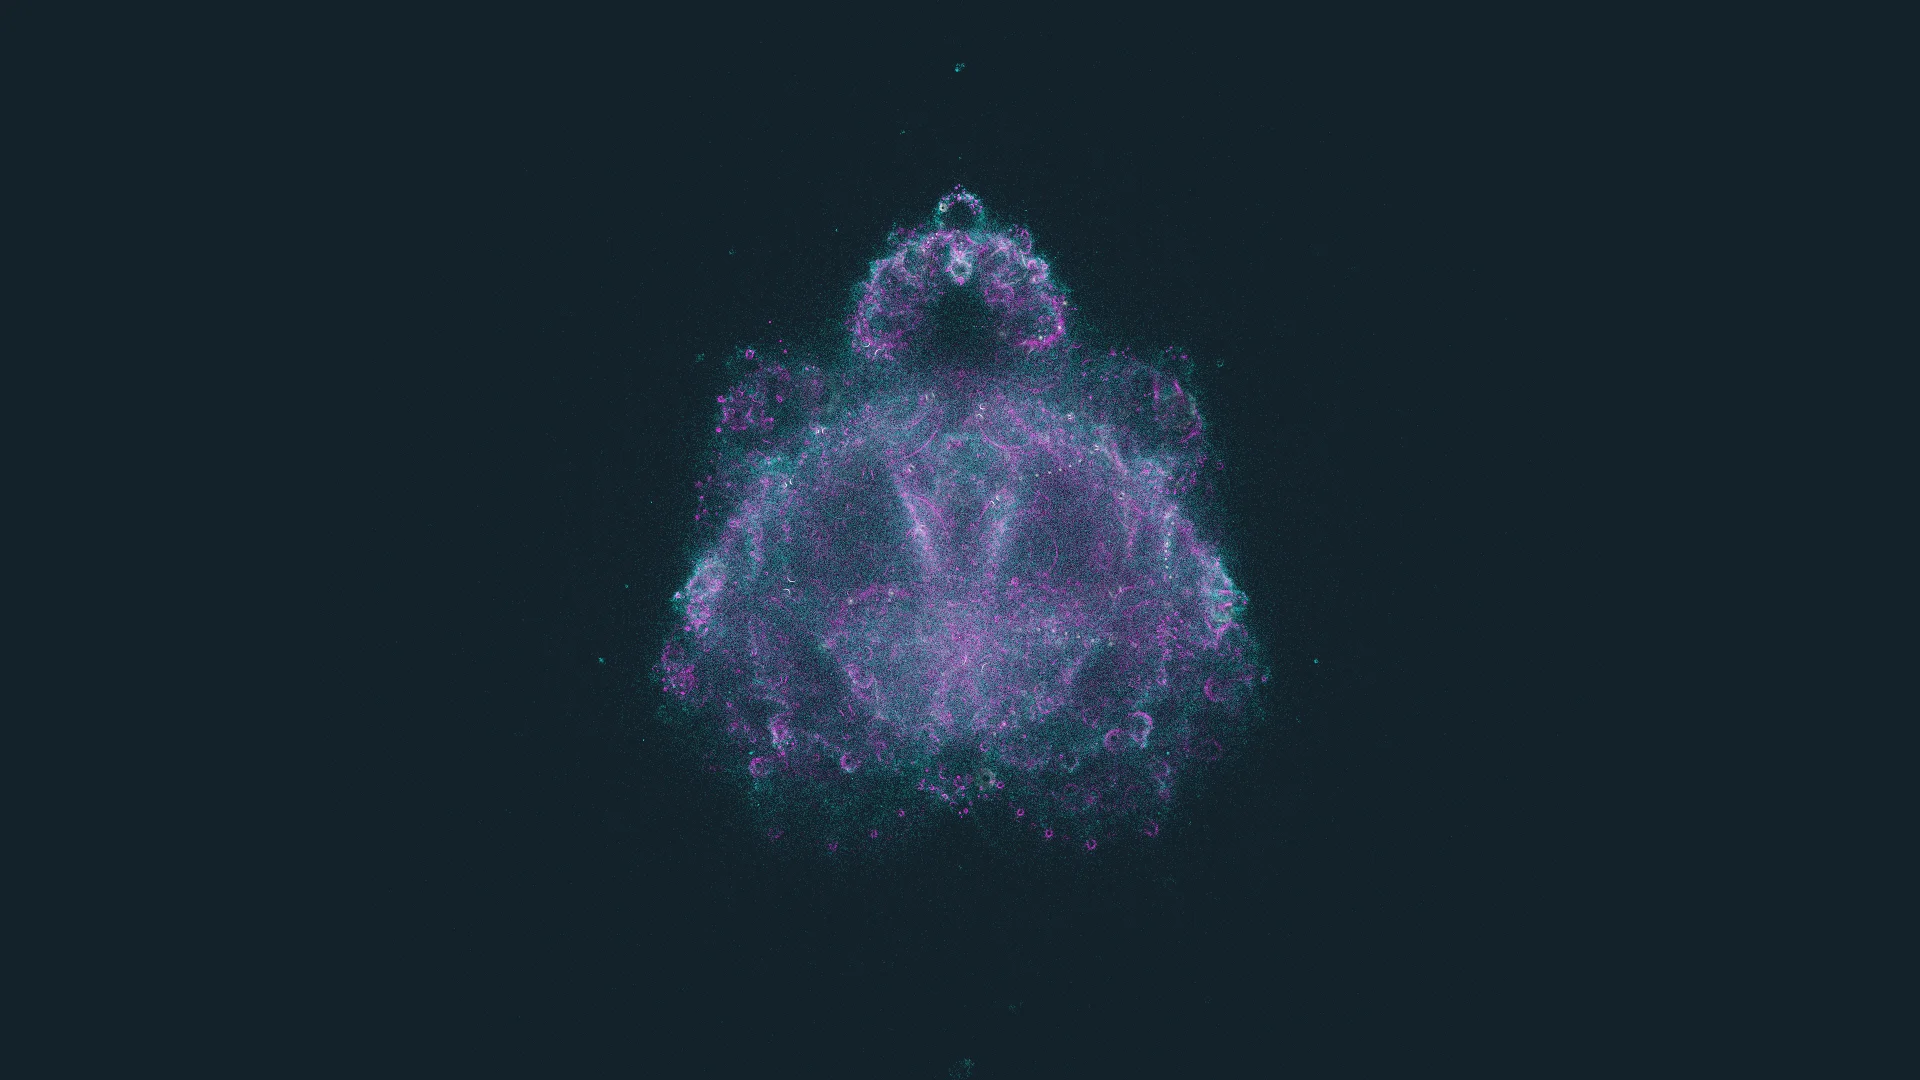
The Nebulabrot is a striking visualization technique that reveals the hidden orbital structures within the Mandelbrot set. Unlike traditional fractal rendering that colors points based on their escape time, the Nebulabrot visualizes the actual paths (trajectories) that points take as they escape to infinity.
This accumulative rendering technique was pioneered as the "Buddhabrot" and later extended to color versions like the Nebulabrot. Each pixel's brightness represents how many escaping trajectories passed through that location, creating intricate, nebula-like patterns that reveal the underlying mathematical dynamics.

Mathematical Foundation
The Nebulabrot is based on the same iterative formula as the Mandelbrot set:
However, instead of coloring points based on when they escape, we:
- Sample random points in the complex plane as starting values for c
- Iterate each point and record its complete trajectory
- Filter trajectories by their escape time (iteration count)
- Accumulate points from qualifying trajectories into color channels
- Render the density of accumulated points as brightness
Color Channel Filtering
The Nebulabrot's distinctive appearance comes from filtering trajectories into different color channels based on their escape times:
Red Channel
Deep Structures
10,000 - 20,000 iterations
Captures points that take the longest to escape, revealing the most intricate boundary details.
Green Channel
Medium Structures
1,000 - 5,000 iterations
Shows intermediate complexity regions with moderate escape times.
Blue Channel
Surface Structures
100 - 500 iterations
Reveals the outer regions and faster-escaping trajectories.
This separation creates a natural depth effect where different mathematical "layers" of the Mandelbrot set are visualized in different colors, combining to form the characteristic nebula-like appearance.
Rendering Techniques
Accumulative Rendering
Unlike real-time fractals that calculate each pixel once, the Nebulabrot builds up its image over time:
- Each frame generates thousands of new sample points
- Trajectory points are accumulated in GPU framebuffers
- The final image emerges through statistical sampling
- Longer rendering times produce higher quality results
HDR Tone Mapping
The accumulation process can create very high dynamic range values. Our implementation uses:
- Exposure Control: Adjusts overall brightness
- Reinhard Tone Mapping: Compresses high values while preserving detail
- Gamma Correction: Ensures proper display on standard monitors
Performance Optimizations
Our implementation includes several optimizations to handle the computational intensity:
- Mandelbrot Rejection: Skip points in the main cardioid and period-2 bulb (~40-60% reduction)
- GPU Acceleration: All point rendering occurs on the graphics card
- Adaptive Quality: Render resolution scales with device capabilities
- Batch Processing: Generate 20,000+ points per frame efficiently
Interactive Features
Animation Methods
- Static Generation: Pure accumulation without parameter changes
- Evolving Iteration Bands: Slowly shift the iteration ranges over time
- Pulsing Intensity: Breathing effects with exposure and density variation
- Color Band Shifting: Move iteration bands to create flowing color effects
- Interactive Navigation: Pan and zoom with accumulation reset
Custom Controls
When Nebulabrot is selected, additional controls become available:
- HDR Exposure: Fine-tune brightness and contrast
- Iteration Bands: Adjust the ranges for each color channel
- Clear Accumulation: Reset the image to start fresh
- Debug Information: View generation statistics (press 'b' key)
Mathematical History
The Buddhabrot technique was discovered by Melinda Green and was inspired by the resemblance of the resulting images to depictions of Buddha in meditation. The name "Nebulabrot" refers to colorized versions that resemble astronomical nebulae.
This visualization method reveals aspects of the Mandelbrot set that are invisible in traditional escape-time rendering, showing the actual flow and structure of the mathematical dynamics rather than just boundary information.
For more technical details about the original concept, see the original Buddhabrot documentation by the technique's pioneers.
Tips for Exploration
- Be Patient: High-quality Nebulabrot images require time to accumulate detail
- Experiment with Iteration Bands: Try different ranges to highlight different mathematical structures
- Use Different Color Palettes: Each palette can reveal different aspects of the orbital structure
- Monitor Statistics: Press 'b' to see generation rates and escape statistics
- Try Different Animation Methods: Each creates unique visual effects
- Adjust Exposure: Fine-tune to see both bright and subtle details
Further Reading
Explore these canonical resources to deepen your understanding of the Nebulabrot:
- Melinda Green's Original Buddhabrot - The foundational documentation by the technique's pioneer
- Wikipedia - Buddhabrot - Overview of the statistical approach to Mandelbrot visualization